Graph of the machine axes window
This feature allows you to view the change in the values of the machine axes over time as the tool travels along the path for the current operation as a set of graphs. In order to get a graphic, you need to select the calculated operation in the list of operations and click on the button  on the main toolbar.
The window has the following form.
Axes. It is possible to disable the visibility of individual axes and assign a color to them by clicking on the colored square.
Auto Y-scale. For ease of viewing, the vertical size of the graph of each axis is stretched to the same height. When enabled, the scale on the vertical axis is automatically selected by the maximum and minimum values of the axes. The scale on the horizontal axis can be changed by rotating the mouse wheel while the pointer is in the graphics area.
Highlight extremums. Allows you to display in the form of points the places in which the direction of change of the axis is reversed.
Simulation. The
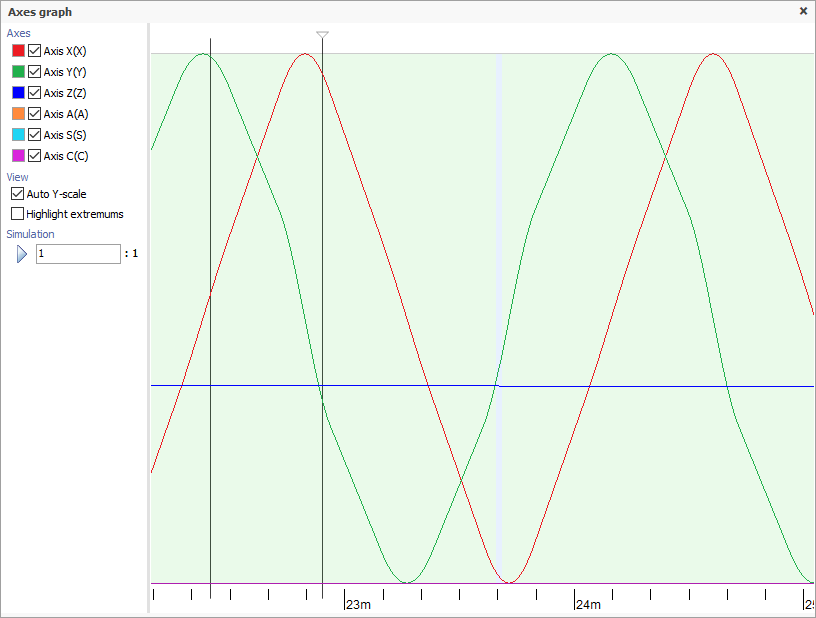
 button starts the simulation of the movement of the tool and all axes of the machine synchronously in the main graphics window and on the axes graph. The running marker will display the current position on the axis chart. By clicking the left mouse button on the graph, you can set the position of the marker at an arbitrary point in time. You can change the speed of the simulation by scrolling the mouse wheel or manually entering in the field
  .
.
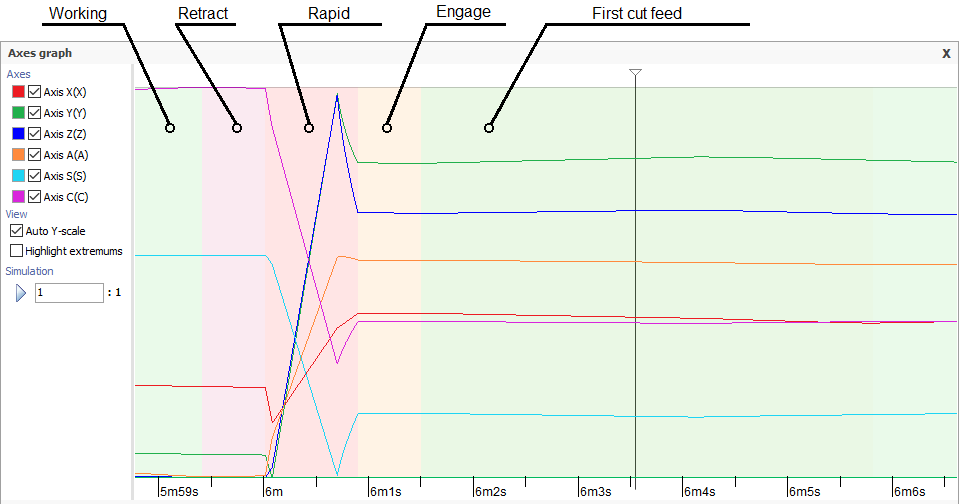
The background color below the graph indicates the type of feed on which the movement is performed: working, rapid, engage, retract, etc.