Interpreter debugging in Visual Studio Code
To debug native .NET-based G-code interpreters (C#), you must do the following:
Download and install the latest available version of Visual Studio Code (https://code.visualstudio.com/download, size 90 MB).
Install the C# for Visual Studio Code from the Visual Studio Code marketplace (https://marketplace.visualstudio.com/items?itemName\u003dms-dotnettools.csharp).
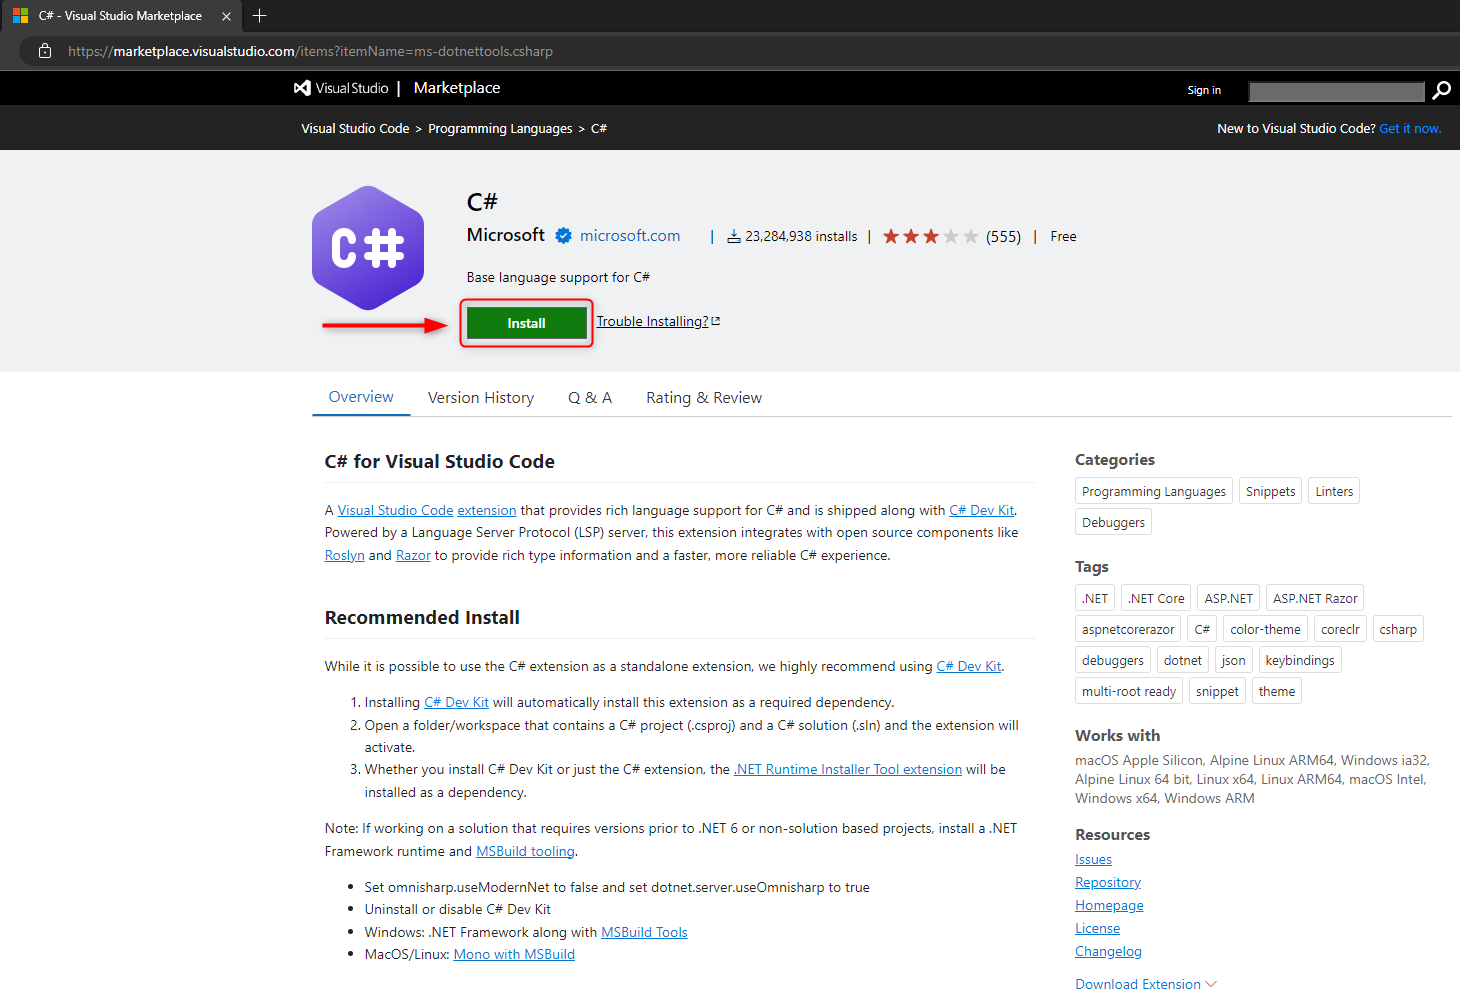
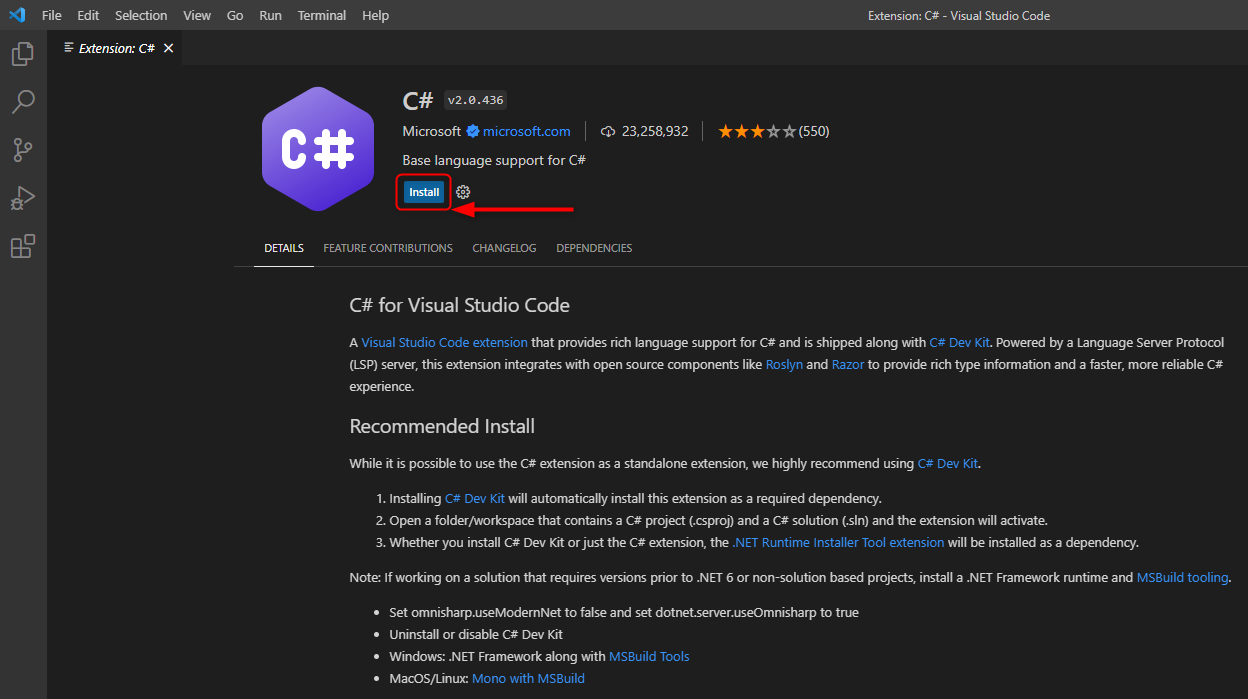
After clicking the Install button, VS Code (short for Visual Studio Code ) will open on the Extensions tab. Just click the Install button next to the extension name.
For more convenient editing of snci files, it is recommended (but not required) to install the XML Language Support by Red Hat extension (https://marketplace.visualstudio.com/items?itemName\u003dredhat.vscode-xml).
If you have not already done so, you need to download and install the latest version of SprutCAM X (requires version 17 or higher) from the official website (https://sprutcam.com/download/).
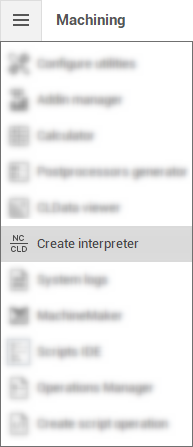
Next, you need to launch SprutCAM X and select Create interpreter in the utilities menu.
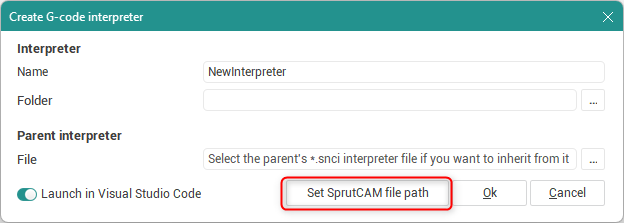
In the window that appears, you need to click the Set SprutCAM X file path button and set the path to the sc.exe file located in the SprutCAM X installation directory (by default it is 'C:\Program Files\SprutCAM Tech\SprutCAM X 17\Bin64\sc.exe').
This process adds the environment variable 'SprutCAM_NCKernelDir' to the Windows environment variables. To be able to launch Visual Studio Code from SprutCAM X, the 'Path' environment variable must include the VS Code installation folder. Typically, the Visual Studio Code installer will add it by default.For changes in Windows environment variable settings to take effect, it is recommended that you restart your computer after setting the path to the sc.exe executable file and finishing installing VS Code.
Then launch SprutCAM X again and select Create interpreter in the utilities menu. Now you can create a new interpreter by specifying its name in the Name field and a directory in the Folder field, in which a folder corresponding to the interpreter name will be created with all the necessary source files.
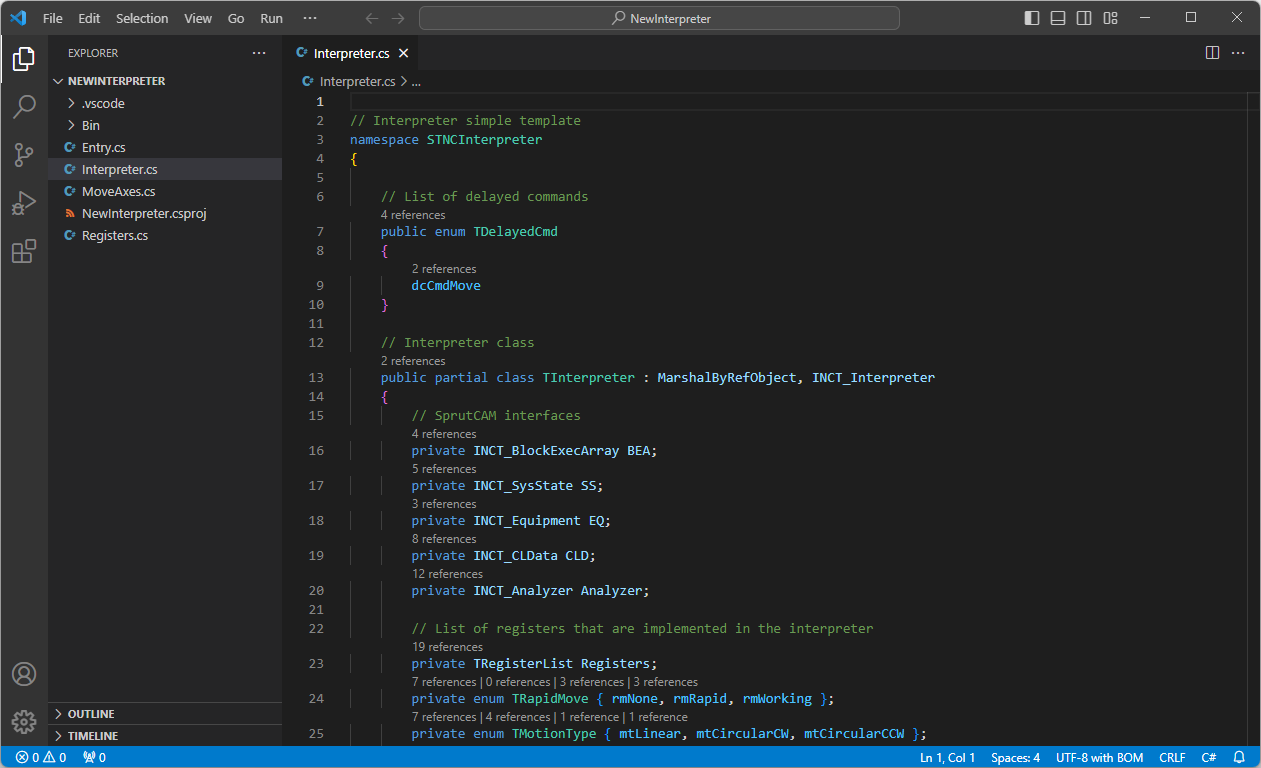
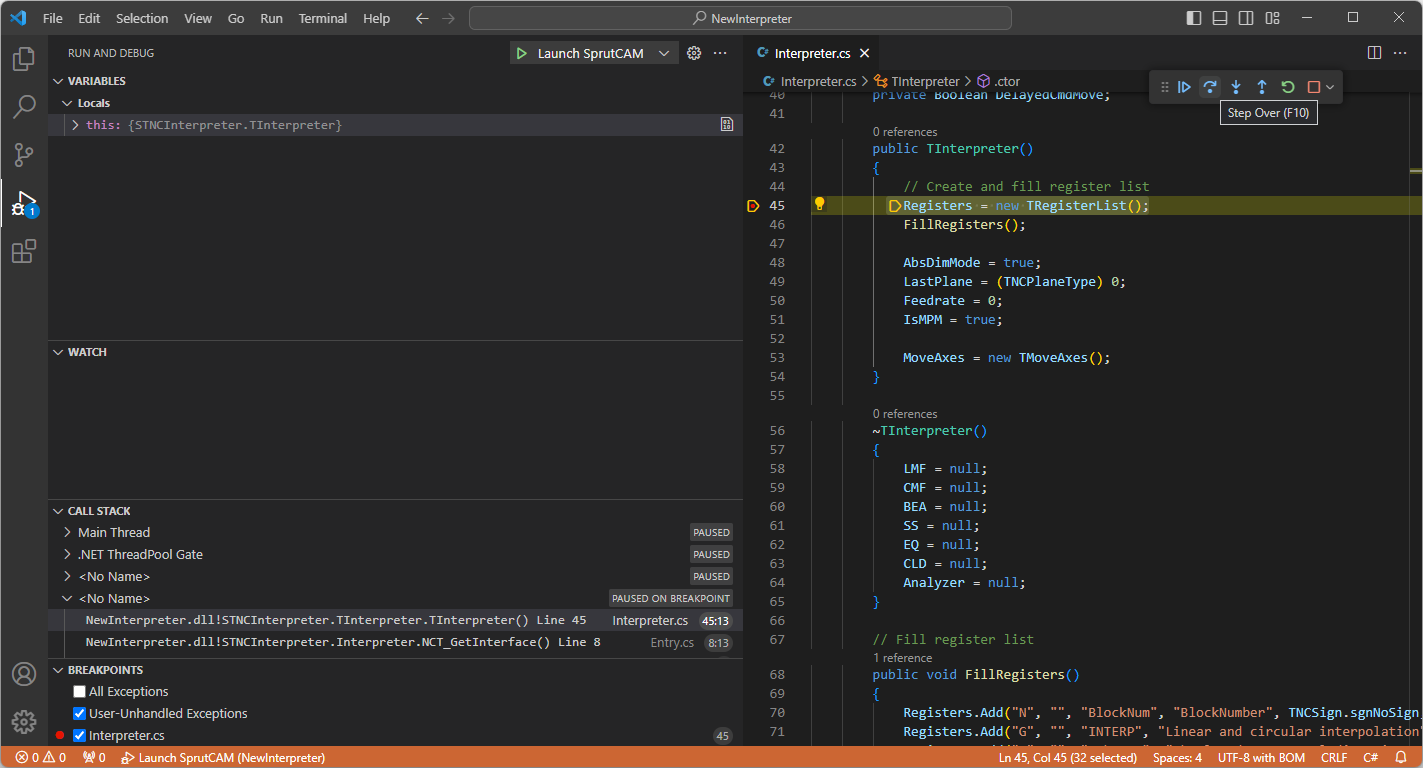
After clicking the <Ok>button, a new Visual Studio Code window will open with the tab of the main source file of the 'Interpreter.cs' interpreter open.
Then you can set a breakpoint on any method (for example, the constructor of the TInterpreter class), switch to the 'Run and Debug' tab and click on the 'Launch SprutCAM' button (F5 key).
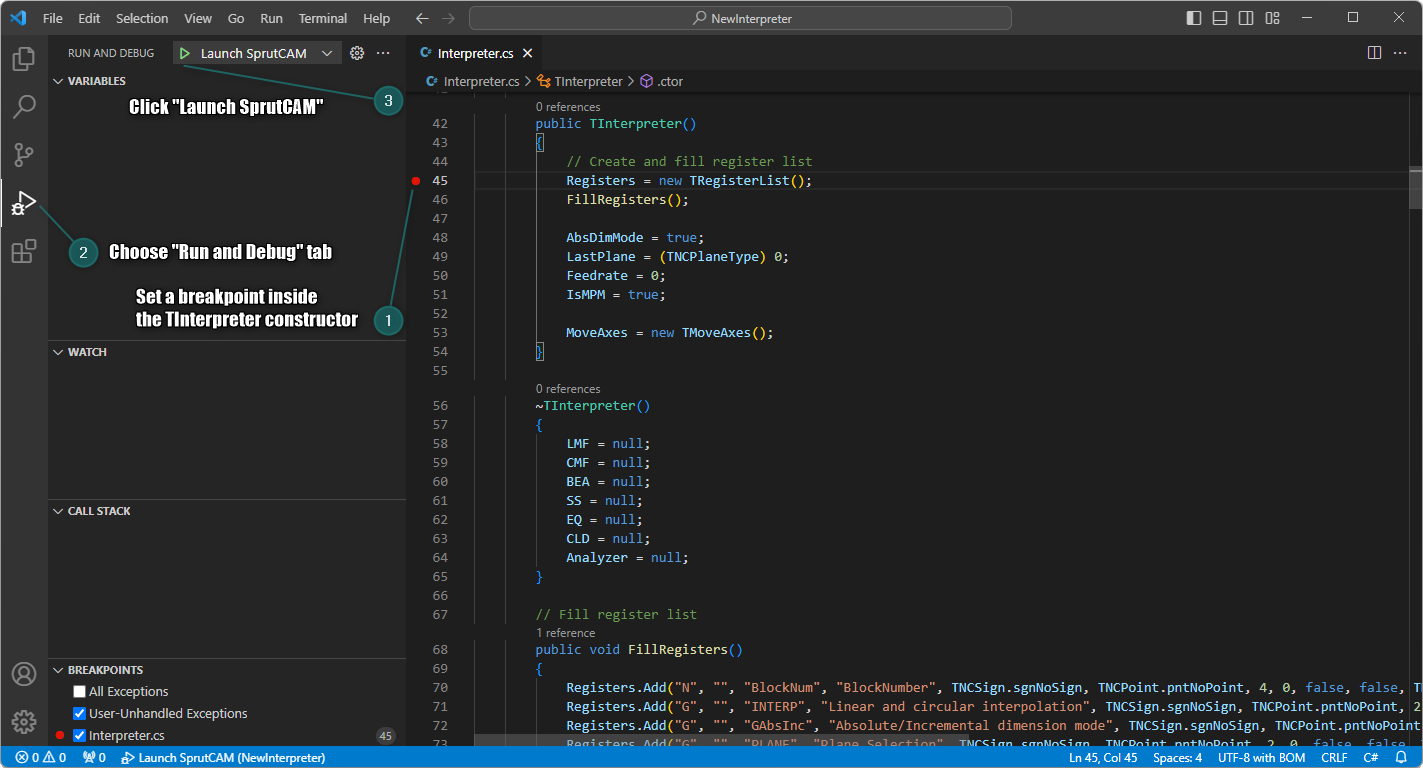
As a result, the interpreter will be built from source, SprutCAM will start and the source code will be debugged.
To check the operation of the interpreter, you need to create an G-code based operation in the SprutCAM X window that opens.
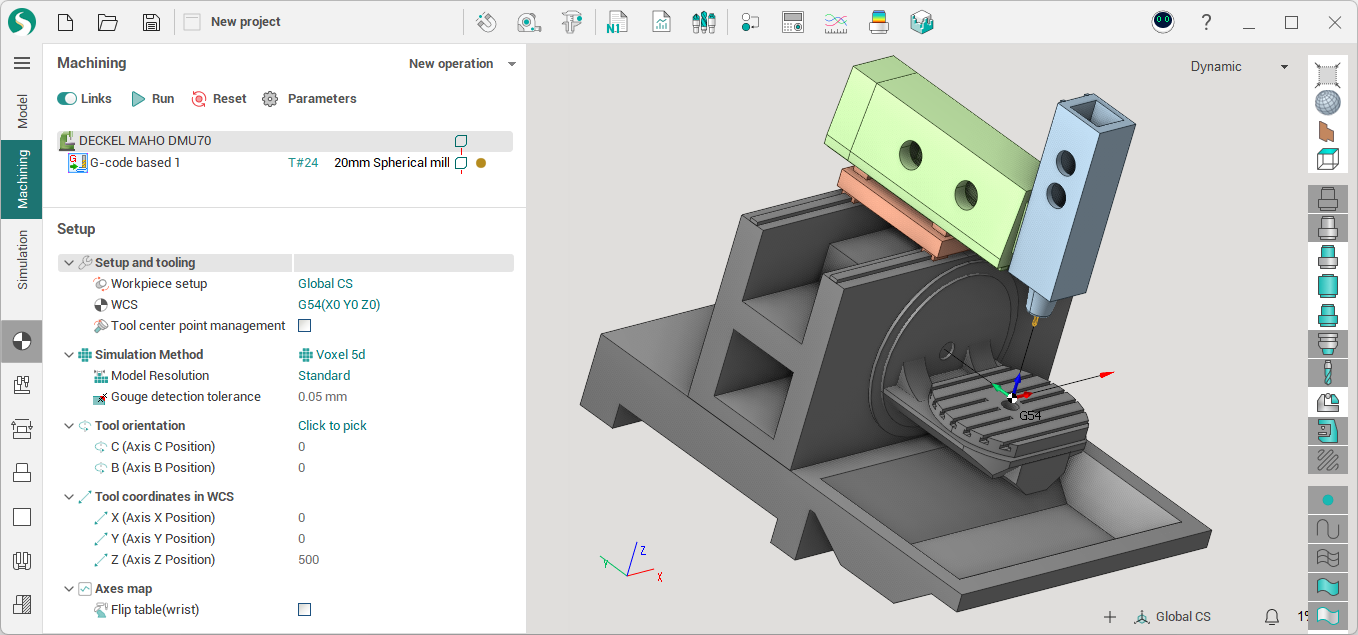
Specify some NC text in the <Job Assignment > G-code based operation parameters panel, for example:
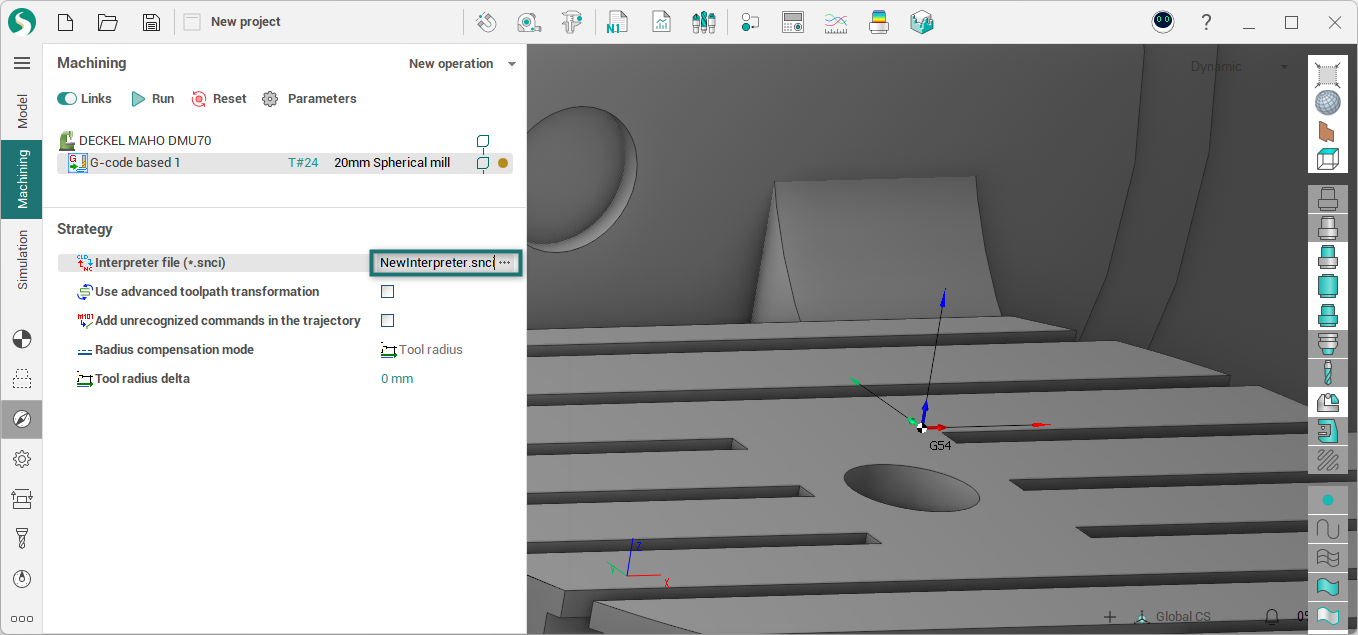
G0G17X0Y0Z0X100Y100X0Y0Select the created interpreter in the <Strategy> operation parameters panel:
And press the button
 to calculate the operation
Execution must stop at the specified breakpoint. You can now use Step Over (F10) in the toolbar to move through the lines of interpreter code.
Finally, you can modify the interpreter code in the Interpreter.cs, Registers.cs, and NewInterpreter.snci files as needed and debug it using all the available Visual Studio Code features. If you are not yet familiar with the capabilities of VS Code, we recommend that you visit the “Get Started” section of its official documentation (https://code.visualstudio.com/docs/getstarted/introvideos).
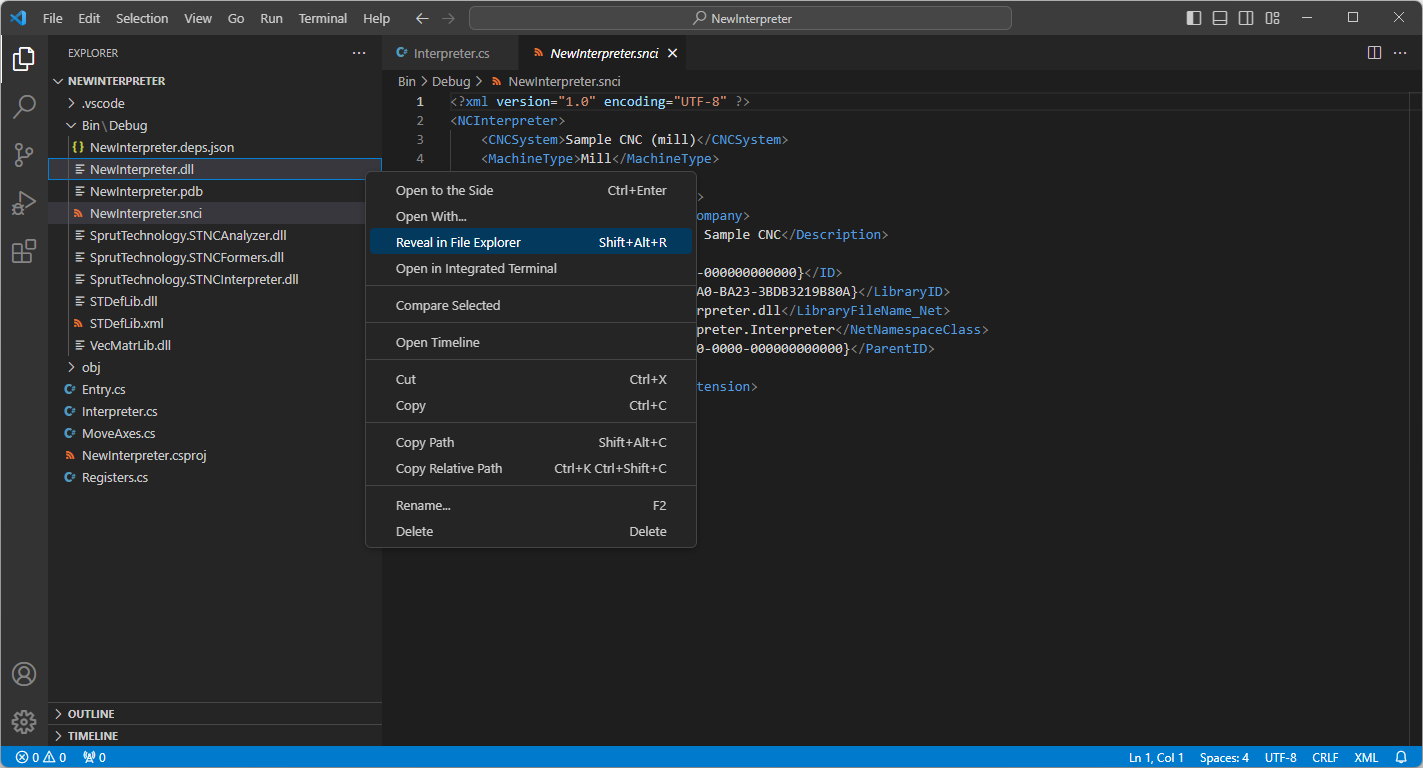
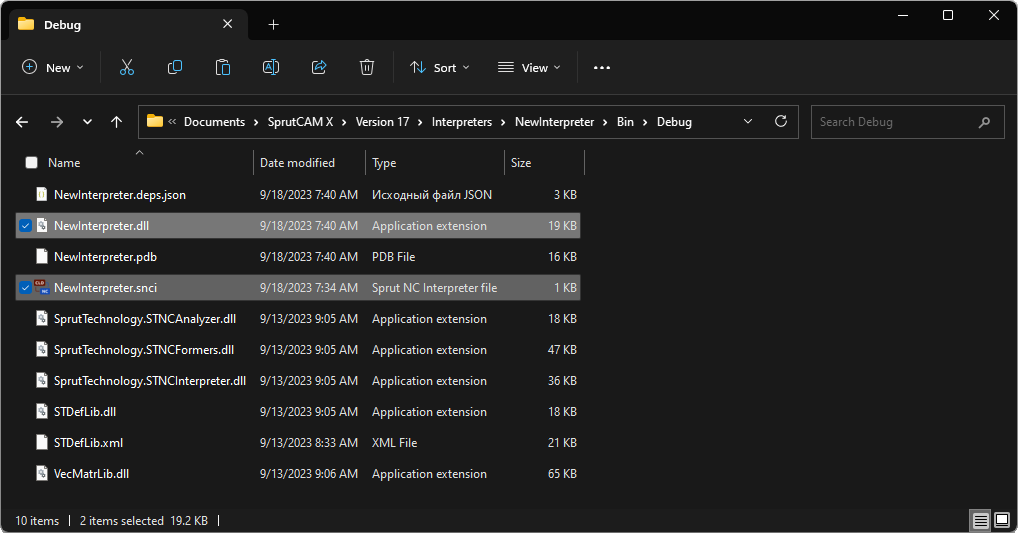
Once you have written and debugged the interpreter source code, you can obtain and use the dynamic load library (*.dll) and interpreter configuration (*.snci) files. Simply select 'Reveal in File Explorer' from the context menu of the relevant files (such as NewInterpreter.dll and NewInterpreter.snci in this case) in the Visual Studio Code Explorer. In this case, the specified interpreter files will be selected in the explorer, which you can copy and, if necessary, send to the client.